Annotation Density Plot
An annotation density plot visualizes the distribution of annotations (the segmentation) over the media duration or over a selected time interval. The textual annotation values are ignored.
Figure 325. An annotation density plot
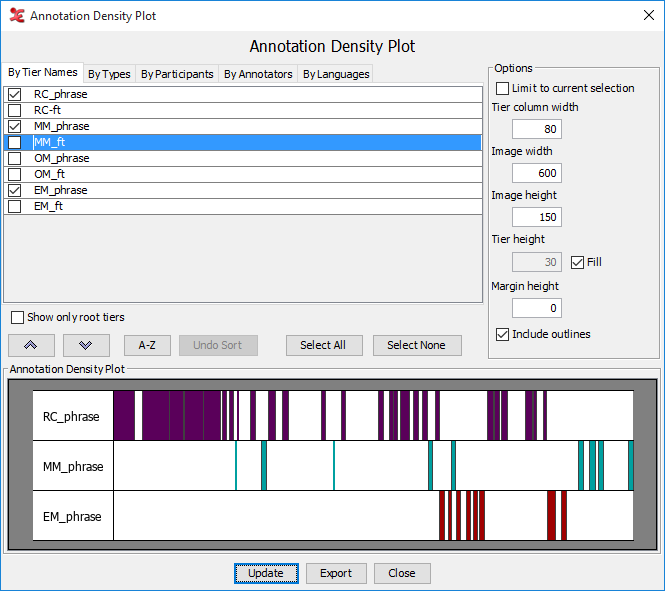 |
There are a number of options to customize the visualization and the result can be saved as an image. Apart from the usual tier selection options the following settings are available:
Limit to current selection the plot will be restricted to the current time selection
Tier column width the width in pixels available for the tier names. Set to 0 to switch off tier names.
Image width the width of the image in pixels
Image height the height of the image in pixels
Tier height the height of a tier layer in pixels
Tier height - Fill when this box is checked the tier height is calculated such that the entire height of the image is occupied by the selected tier layers. A minimum height is applied, a message will be shown if the tiers don't fit.
Margin height the white space above and below each colored band in pixels
Include outlines when checked, grid lines will be drawn to mark the boundaries between tiers
After making changes click the button to see the new
settings in effect. Click the button to show a
Save As window and save the result as a PNG
image.
Figure 326. The effect of unticking the checkbox
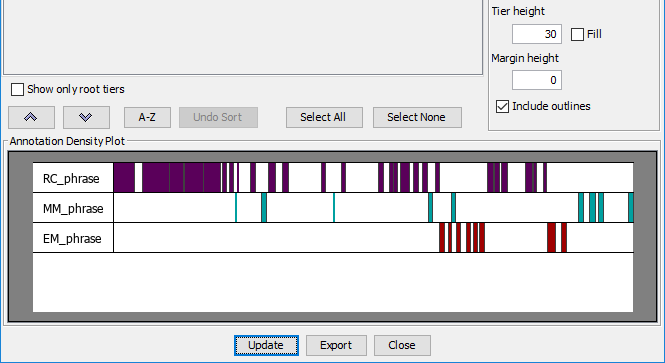 |