View search results in Alignment View
From the context-menu (right-click the search results), you van view query results from the Multiple Layer Search in Alignment View:
Figure 412. Alignment View
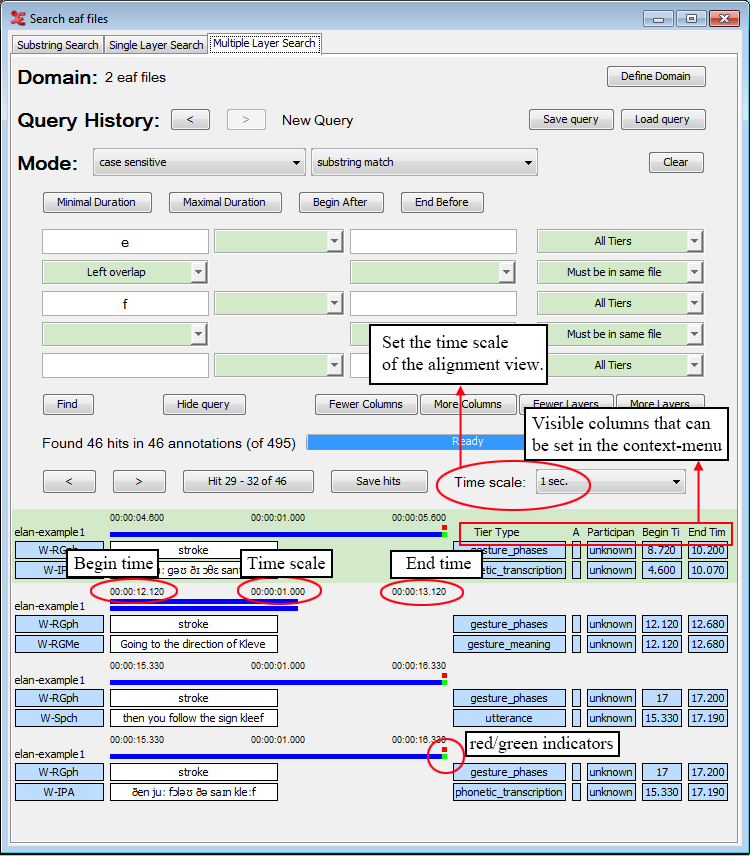 |
There are a number of options you can set when viewing the query results. Firstly, you can adjust the time scale of the results:
1 sec / 2sec / 5sec / 10 sec / 15 sec / 20 sec / User defined / Scale to fit.
When choosing 'Scale to fit', every query result will be scaled to fit the window, which means the time scale for every result will differ.
There is also the possibility to hide the alignment time scale altogether. To do so, go to the context-menu (right-click) and uncheck by clicking on it.
You can set the visible columns to the right of the query results through the context-menu (right-click anywhere in the results). You can show or hide the following columns:
Tier Type
Annotator
Participant
Begin Time
End Time
Duration
The blue bars above every query result graphically show the duration of each annotation and the position of the annotations with respect to each other.
There are also two indicators visible, depending on the length of the query result and the setting of the time scale. These indicators are either red or green.
A green indicator means that the annotation does not fit in the current time scale. In the example above, the bottom annotation 'and then you see um a man in maybe his fifties' has a duration of 5.060 seconds. The time scale is set to 1 second, so 4.060 seconds are outside the current view.
The red indicator means that the annotation in the query result starts outside of the current time scale. The top annotation 'fifties' overlaps the bottom annotation, but starts at 9.177 seconds. This causes it not to be visible in the current time scale, which is set to display 1 second. You would need to set the time scale to 10 seconds to see both annotations visualised completely (as the blue bars) and how they overlap.