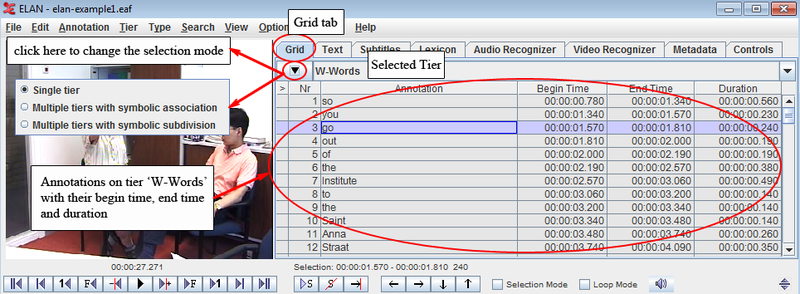
The Grid Viewer displays the content as well as the begin time, end time and duration of all annotations from a single tier. You have to activate this Viewer through selecting the tab next to the video window.
It is possible to select annotations within the Grid Viewer (by clicking on
them), or to edit them (by double-clicking on them).
The time format of the begin time, end time and duration can be changed. Right click on the Grid Viewer, select and select one of the available formats: (hours:minutes:seconds.milliseconds), (hours:minutes:seconds.frames), (hours:minutes:seconds.frames) and (milliseconds).
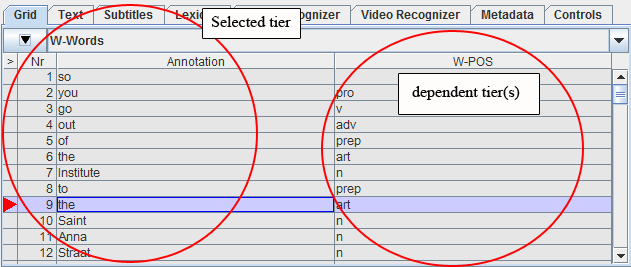
By default the Grid Viewer works in single tier mode. To switch to other multi tier modes with symbolic association tiers or with symbolic subdivision tiers, click on this dropdown menu button which is indicated in the figure that is above. In that case all the annotations of the selected tier will be shown in the grid, together with all symbolic associated/symbolic subdivision tiers (see Section 5.1). Empty cells of dependent tiers can also be filled in this way.
Exporting from the Grid Viewer
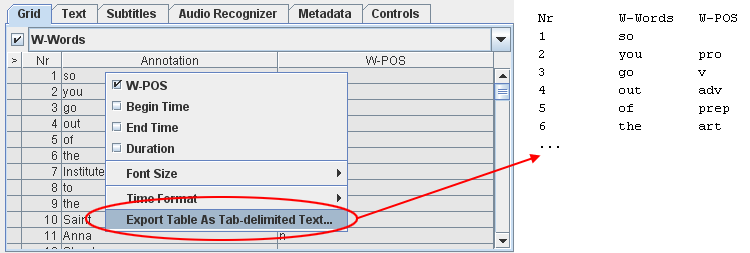
The results as shown in the Grid Viewer can be exported to a (tab-separated) text file, for later manipulation with e.g. a spreadsheet. Follow these steps:
First make a selection of the tiers you want to be displayed (and thus exported)
Right click on the Grid Viewer and select
Enter the name of the file to be created and choose Save