The Audio Spectrogram detail window
In addition to audio visualization in the Waveform Viewer, it is possible to visualize audio sources in the Spectrogram Viewer (see the section called “The Spectrogram Viewer”). The creation of a spectrogram image, and updating it during playback and while navigating backward and forward in the recording, requires a lot of computing power. This can slow down the application on average desktop and laptop computers, to the extend that it is best to switch the Spectrogram Viewer off.
As an alternative, it is possible to create a static audio spectrogram based on the current selection in the Waveorm Viewer and show it in a popup window. This window can be resized, shows the spectrogram image with more detail and can be used e.g. to finetune the selection. From the context menu, choose the option . A window like the following will appear .
Figure 83. The Audio Spectrogram window
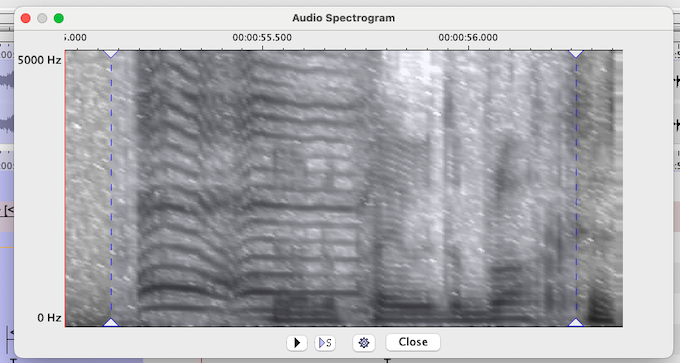 |
A spectrogram of the selection has been created, with some extra samples (roughly 10%) to the left and right of the selection. There is a time ruler at the top, frequency labels to the left and a few buttons below the image. The time selection is marked by a light blue, semi-transparent color and dashed lines with triangular knobs to mark the begin and end time boundary. The boundaries can be changed by dragging the knobs to the left or right. Or by using the keyboard:
ARROW LEFT and ARROW RIGHT move the left boundary (begin time) with one pixel to the left or right
SHIFT+ARROW LEFT and SHIFT+ARROW RIGHT move the right boundary (end time) with one pixel to the left or right
The selection is connected to the main window, i.e. changing the selection here, changes the selection in the main window (in case of dragging with the mouse, the selection is updated after releasing the mouse button).
The buttons have the following functions:
plays the entire interval visible in the window, starting from where the crosshair happens to be
plays the selection from begin to end
opens the Spectrogram Settings window, as described in section the section called “The Spectrogram Viewer”
closes the window
![[Note]](images/note_1855015319.png) | Note |
|---|---|
The spectrogram detail window is not connected to the media player in the main window. Instead, the audio samples which are provided by the Waveform Viewer for the visualization of the spectrogram, are used to create an in memory JavaSound player. This means that the audio that is produced, is taken from the media file which is visible in the Waveform Viewer. |
| Note |
|---|---|
There may be platform specific issues with audio playback in case the source is a video file and the audio has been extracted with the FFmpeg option. |
The right mouse button context menu of the spectrogram image allows to select which channel(s) to display (in case the source has more than one channel). It is possible to show only channel 1 or 2, or 1 and 2 merged or separate.